The platform, as it is.
A terminal with the chart, the book and the market on one screen, an assistant that reads your account before it answers, and terms published before you trade.
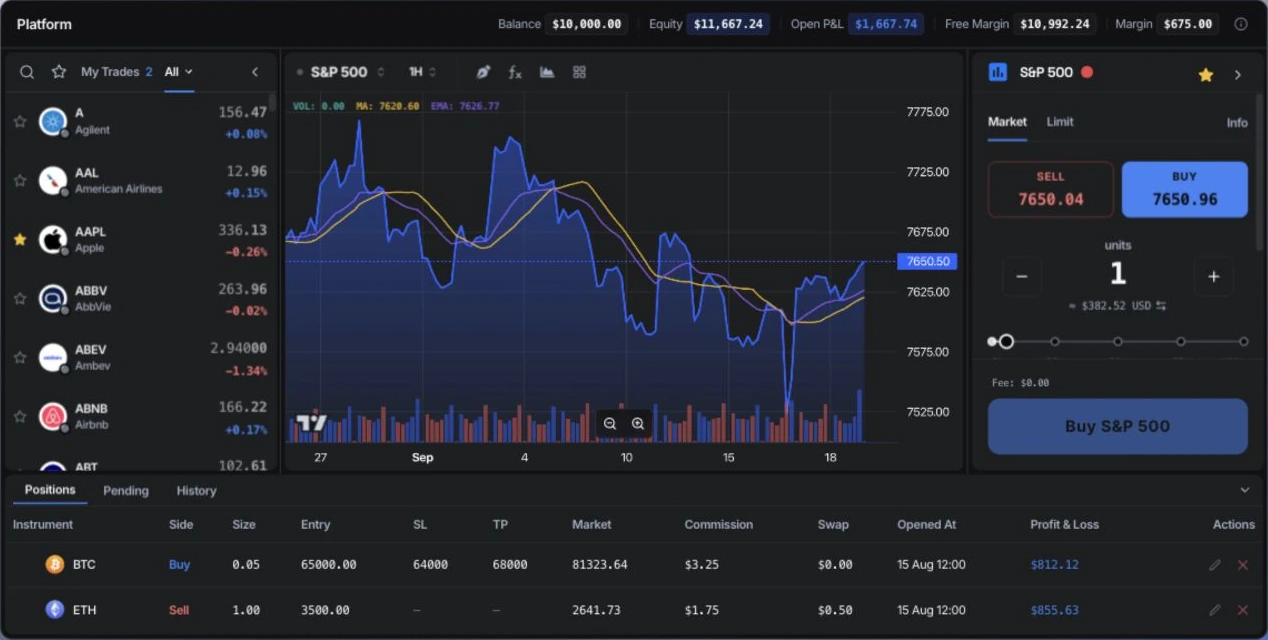
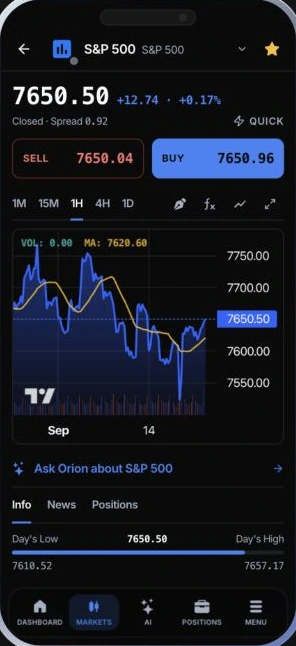
The terminal
Where the trade actually happens — charts, orders, and what the market is doing right now.
Pro Terminal
Run 1, 2, or 4 charts side by side, collapse the order and position panels to free up screen space, and place trades straight from the chart.
Matters if you track more than one instrument at once. If you only ever watch a single chart, you likely won't notice the difference.
Charting toolkit
Twenty-two indicators in five groups — moving averages, bands and channels, trend, oscillators, volume — and trend lines, rays, rectangles and Fibonacci, on every timeframe, on TradingView's open-source engine.
If you trade off technical setups, this is what you check before every entry. If you trade on news or fundamentals alone, it is a nice-to-have, not the reason to choose us.
Orders, stops and targets
Every tickMarket, limit and stop orders, with Stop Loss and Take Profit on every position — set from the order panel or dragged on the chart. Stops and targets are judged on every tick of the price feed, not once a minute.
The three order types that cover how most positions are actually opened and protected, and a stop that fires at the price it names.
Market Movers
LiveToday's biggest gainers and losers across your watchlist, with live sparklines.
A five-second glance to catch momentum, instead of checking instruments one by one to find what's actually moving.
One chart, or four
Split the workspace into one, two or four charts and collapse the order and position panels when you want the screen back. The layout you leave is the layout you return to.
Indicators and drawing tools
Twenty-two indicators and four drawing tools, applied per chart rather than globally — so a moving average on your EUR/USD chart does not follow you to gold. Below, three of them on gold, on the chart the terminal draws with.
Live gold with a 50-day moving average, Bollinger Bands and RSI. Real prices; the chart can be switched between candles and area.
Moving averages
SMA 20SMA 50SMA 200EMA 20EMA 50EMA 200VWAP
Bands & channels
Bollinger BandsKeltner ChannelDonchian Channel
Trend
Ichimoku CloudSuperTrendParabolic SAR
Oscillators
RSIMACDStochasticATRADXCCIWilliams %R
Volume
OBVVolume
Drawing tools
Trend linesRaysRectanglesFibonacci
Reading your account
The part that knows what you hold, and can say something useful about it.
Personalized OrionAI
26 live toolsOrionAI reads your real account — balance, win rate, profit factor, open and closed positions — and the market through twenty-six live data tools: prices, history, company statements, the week's calendar, sectors and movers.
So when you ask "am I overexposed?" it checks your actual positions and today's market, instead of giving a textbook answer that ignores what you're holding.
Baskets
34 readyThirty-four ready baskets across sectors, themes, macro and crypto, weighted equally, by market cap or by risk — and baskets of your own. One P&L, one exposure, one button to buy them all.
Useful if you trade a thesis rather than a ticker and want one number, not five to add up yourself.
Statements and the week ahead
Income statements, balance sheets and cash flow for every listed stock, the earnings and dividend calendar for the week, and the day's movers by sector — in the terminal, on the same data as the prices.
So the fundamentals sit next to the chart rather than in another tab, and the week's events are known before they move a position.
Ask it about the market, then about your book.
The same assistant that runs inside the terminal, live: it opens the conversation itself and answers from the desk's data. Inside an account it also knows what you hold.
Talk to OrionLive. A few questions per visit, no signup.
Costs, support and access
The things that decide whether a platform is pleasant to live with.
Transparent Pricing
Every spread and commission is published per asset class before you trade — not buried in a PDF or disclosed after the fact.
You can calculate the exact cost of a trade before you place it, not after — worth checking against wherever you trade now.
24/7 Support, Your Language
Live chat, Telegram, WhatsApp and email — in English, German, Spanish, Portuguese and Russian, the five languages the platform speaks.
Matters most if you trade outside standard business hours or don't want to explain a problem in your second language.
Install as an App
Add OrionBroker to your home screen on iOS, Android, or desktop, straight from the browser.
One tap to open, no app store, no update prompts. Matters if you check positions from your phone; skip it if you only ever trade at a desk.
Under the hood
What's actually running behind the interface.
Live market data
Prices stream over a socket for every instrument in the catalogue — the same tick that draws your chart, values your positions and judges your stops, not a delayed snapshot.
Verified before you withdraw
Identity verification (KYC) runs before your first withdrawal — a real compliance step, reviewed by our team, not a checkbox you tick and forget.
You are notified, every step
Deposit confirmed, withdrawal processed, password changed, new sign-in detected — every account event lands in your inbox automatically.
See it for yourself.
Open a free demo account and try the terminal — no card required.
Register
An email and a password. The demo opens with it.
Fund
Crypto from $10, credited once the network confirms.
Verify once
Before your first withdrawal; a person reviews each one.